Assessing market psychology is the ultimate goal of any trader or investor, because current market behavior will determine future consensus on value, whether it's the price of stocks, futures, options, or commodities. To assess market behavior more effectively, we need to refer to some complex indicators, and sometimes even create some new ones. In behavioral finance, there are many interesting and complex indicators of crowd psychology. In this article, we will focus on the Herrick Payoff Index (HPI) and the New-High New Low Index (NH-NL).
Herrick Payoff Index (HPI)
The Herrick Payoff Index was proposed by John Herrick. It is mainly used to measure changes in price, trading volume and open interest in order to confirm valid trends and help predict the reversal of market trends. The index is calculated using daily highs, lows, volume and open interest (preferably including all futures and options contracts) for at least three weeks. The price used in the calculation is the delivery month with the most active transactions, and the average price is used in the calculation instead of the closing price, because the average price can better reflect the average value consensus of the day. When the trading volume increases, the absolute value of HPI for the day also increases.

A rising open interest is a bullish signal when the market is up and a bearish signal when the market is down; a falling open interest is a bearish signal when the market is up and a bullish signal when the market is down; a flat open interest is a neutral. The same principle applies to the HPI: if the index breaks a long-term trendline, it is an early signal that the price will break out of the trendline; when the HPI crosses the centerline, it confirms that a new trend in price has formed. We can take this principle even further: when the price reaches a new low, but the value of the HPI is higher than the previous low, this signals a buy (bullish divergence). When the HPI begins to recover from the second low, traders can place a protective stop below the most recent low. Correspondingly, a bearish divergence occurs when the price reaches a new high but the value of the HPI is lower than the previous high. When the HPI turns to the downside, a bearish sell signal appears, and traders should place a take profit above the most recent high. The HPI can reflect the overall bullish or bearish trend of the market. When the HPI is above its centerline, the market is in a bull market; when the HPI is below its centerline, it is wise to go short.
New-High New Low Index (NH-NL)
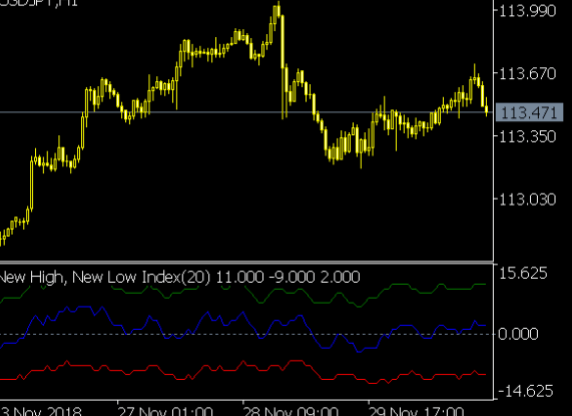
The New-High New-Low Index is only applicable in the stock market. It measures the number of stocks that made a new high or new low on any given trading day. It is equal to the difference between the number of new highs and the number of new lows, often used to predict new market bottoms or tops. When the index and actual prices diverge, a market bottom or top may occur. For any stock, if the bulls are in full control of the market, the price will make a new high, whereas a new low means that multiple bears are fighting against the bulls, causing the stock price to fall all the way down. The NH-NL can be used as a bullish or bearish indicator for the market: when the new high-new low index rises above the centerline, the market is bullish; when the indicator falls below the centerline, the market is bearish. If both the market price and the NH-NL make new highs, the bull market is likely to continue; if they both make new lows, the bear market is likely to continue.

The concept of divergence is also very important when interpreting the NH-NL. If the market price rebounds but the NH-NL declines, the upward movement may be hindered. Likewise, if the market price reaches a new high but the NH-NL fails to peak, a bearish divergence will occur, which means the momentum of the bull market is starting to wane. If stock prices are falling but the NH-NL is rising, the market trend is likely to reverse soon. If the NH-NL does not continue to make a new low, a bullish divergence occurs, indicating that the momentum of the bear market is starting to weaken.
From the absolute value of the index, if the NH-NL peaks at or near 100 points, the market will be likely to experience a major reversal. If the index exceeds 100, the market trend will continue, but it is very likely to make new highs later. If the NH-NL is close to -100, then the market is likely to rebound soon. If the NH-NL is below -100, the momentum of the decline will weaken, but there will be no immediate rebound. The NH-NL can also be used to guide the trading behavior of open positions. When the NH-NL rises, you can go long or add positions. However, if the market is up and the NH-NL is down, the bulls should close their positions. Conversely, you should go short when the NH-NL is falling, but if the market is down and the NH-NL is rising, the short should be closed. If the market is trading sideways and the NH-NL is rising, it is a bullish signal; conversely, if the NH-NL is falling at this time, it is encouraged to sell short. In the long run, if the NH-NL is less than 0 for a period of time and suddenly breaks the center line, it means that a bull market is coming. If the NH-NL has been above 0 for a long time and suddenly breaks below the center line, it is best to go short at this time.
Technically speaking, the study of market sentiment and crowd psychology does not count as a science, but there are some specific indicators which we can refer to. The HPI can help investors analyze whether it is currently a bull or bear market, while NH-NL can be used to predict the ups and downs of the stock market. While these indices are not perfect, when combined with other tools, they may help you make better analytical and trading decisions.


